
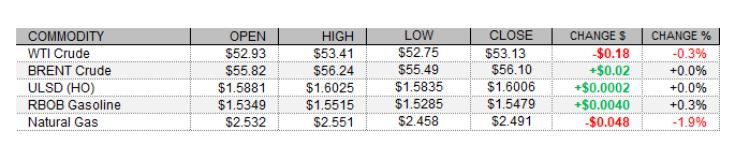
PETROLEUM COMPLEX (WTI | BRENT | ULSD | RBOB)
Petroleum futures opened weaker following bearish weekly US crude oil inventories from the American Petroleum Institute, and WTI crude futures ended the session in the red, but products ended flat to higher. European shares opened flat to higher, but came off and settled in the red, perhaps weighing on today's price action, whereas weakness in the US dollar and strength in US equities were supportive. The FTSE 100 fell 0.4%, the CAC 40 dropped 0.7% lower, and the DAX shed 0.1% following disappointing Eurozone consumer confidence data and an as-expected European Central Bank monetary policy announcement bringing no changes to policy settings. As of this writing, meanwhile, the Dow and S&P 500 were flat while the Nasdaq had added 0.4%. US economic data releases were upbeat, with weekly initial jobless claims (900,000) matching expectations and prior week claims being revised down, a beat in the Philadelphia Fed Manufacturing Index for this month (26.5), and with both December housing starts (1.669m annualized) and permits (1.709m annualized) beating expectations as well. Also supportive for crude, the US dollar index had lost 0.3%.
NATURAL GAS | WEATHER | INVENTORIES
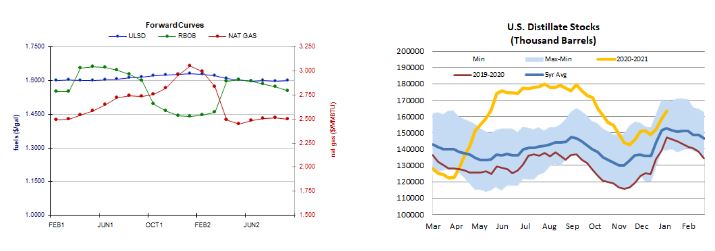
Natural gas futures lost further ground today with a further downgrade to the two-week degree day forecast and loosening picture of next week's US market balance. Cash natural gas prices fell, with Henry Hub prices down 8 cents to $2.57/mmBtu, New York Zone 6 pricing down 36 cents to $2.40/mmBtu, and Algonquin citygate prices dropping $1.51 to $2.99/mmBtu. Refinitiv analysts cut their total US demand forecast for next week by 1.8bcf/d to 125.6bcf/d, while raising their supply forecast by just 0.1bcfd to 99.9bcf/d, implying smaller withdrawals from storage of 25.7bcf/d (compared to 27.6bcf/d previously). The latest ECMWF 1-5 day outlook calls for above-normal temperatures in the Midwest and below-normal temperatures in the Northeast. The 6-10 day forecast is similar, but the 11-15 day outlook has moderated, with above-normal temperatures expected across most of the eastern two-thirds of the country. For the next two weeks, the US GFS sees 410 HDDs, down from 421 previously. This is closer to the 400 HDDs seen last year, and below the 30-year average of 449. The weekly EIA natural gas storage report is due tomorrow, expected by analysts to show a 174bcf withdrawal from storage for the week ended January 15 per a Reuters poll. Petroleum inventories are also due tomorrow, with crude stocks expected to fall by 1.2mb and product stocks rising. A 2.8mb build in gasoline is predicted, and a 1.2mb build is seen for distillates. The US refinery utilization rate is seel falling 0.4 percentage points to 81.6% of installed capacity.
ENERGY TECHNICALS (WTI | ULSD | RBOB | NG)
ULSD futures settled just north of the unchanged mark in a downside session today (lower high, lower low). Bullish momentum looks to be flagging, slow stochastics and the RSI point south, but we settled above nearby 9-day ma support ($1.5955) and did end in the black. We remain neutral/bullish, seeing resistance at $1.6235 (recent high) and then at $1.6424, with $1.5000 support after the aforementioned 9-day ma. RBOB futures added 0.3% in a downside session. Slow stochastics look set to cross in neutral territory, while the RSI is just south of the overbought line. We rmemain neutral/bullish, seeing $1.5756 (recent high) and then $1.6000 resistance, whereas the 18-day ma ($1.4787) and then $1.3899 are seen offering support. WTI fell 0.3% in a downside session today, and while slow stochastics are neutral, the RSI is south of overbought territory. On the other hand, bears could not take out nearby 9-day ma support ($52.88, followed by $50.54) today, and so we 'll stick to our neutral/bullish position for the moment, still seeing resistance at $53.93 and then up at $55.58. Natural gas futures fell 1.9% today, consistent with our downside bias. Slow stochastics are enetering oversold territory but the RSI has some room to fall yet, and the MACD has turned bearish with a cross at the 0 line and a drop under said line. Major averages are shifting from neutral/bullish to neutral as well. We see support at $2.403 and then $2.247, whereas the 100-day ma ($2.645) and then $2.769 are expected to offer resistance.